Windbg Debugging
Windbg is the primary debugging software recommended for use in Patina. While other debugging environments such as GDB do work, Windbg provides native support for PDB symbols, Patina aware functionality with the UEFI Extention, and a robust bare-metal debugging experience. For this reason, the Patina team has invested heavily in this solution, so it has the most robust tooling.
More information and downloads can be found on the Windbg learn page, or Windbg can be installed using the following winget command:
winget install Microsoft.WinDbg
It is recommended to use Windbg version >= 1.2507 for full support. There are known issues with older versions.
Serial Port Forwarding
Windbg currently only supports connecting to the TCP-based GDB server. To support COM and named pipe-based transports, use the forwarding script ComToTcpServer.py to forward traffic between a serial device and a TCP server. This can also be useful if you want to debug from a different machine than the one connected to the device.
Before running the script, install the following pip modules:
pip install pyserial pywin32
Examples of common usages are provided below. For details on full use, run
python3 ComToTcpServer.py --help.
# Forwards a device running on COM5 at baud rate 115200 to TCP port 5555
Python3 ComToTcpServer.py -c COM5 -b 115200 -p 5555

# Forwards a named pipe device to TCP port 5555
Python3 ComToTcpServer.py -n \\.\pipe\patina -p 5555
After the script has started, you can connect the debugger to the forwarded port.
Connecting Windbg
Windbg GDB remote support is provided through the EXDI interface. To connect through
the UI, navigate to Start debugging, select Attach to kernel, and go to EXDI.
This can be done faster using the Ctrl+K shortcut. From the EXDI tab, select the
UEFI target type, your correct architecture, and the address:port you want to
connect to, such as localhost:5555 or 192.168.0.42:5555.
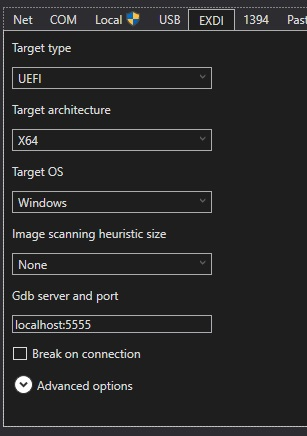
The Target OS and Image scanning fields do not matter, and even the architecture will normally be automatically determined if it is inaccurate.
Diagnosing Connection Issues
There could be several reasons for the connection failing. Below are a few diagnostic steps that can be taken:
-
Check the TCP port. If connected with Putty (or similar), you should be able to connect (without Windbg running) and see
$T05thread:01;#07printed on boot. -
Check for GDB traffic. When connecting, you can select
advanced optionsandshow communication packet logto see the traffic log during connection.
UEFI Extension
The UEFI extension is a critical part of debugging Patina in Windbg. It provides essential tools without which debugging will be substantially harder. This extension adds a suite of UEFI & Patina related commands to windbg.
The most common commands are:
| Command | Description |
|---|---|
!uefiext.init | Initializes the extension, detects the debugger state, and finds modules for symbol resolution. This should always be run on initial connection. |
!uefiext.findall | Finds all loaded modules; can be used at any time. |
!uefiext.info | Prints information about the system, such as the Patina version and the reason for the current exception. |
!uefiext.monitor | Invokes monitor commands on the target. See the monitor commands for more details. |
!uefiext.help | Prints the full list of commands. |
Once the extension has been loaded, you can call !command instead of typing
!uefiext.command each time. So after !uefiext.init, the rest of the calls do
not need to specify the extension.
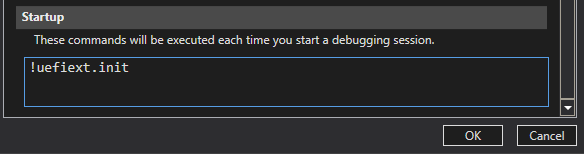
If you frequently debug Patina, add !uefiext.init to the startup commands. This is
found in File->Settings->Debugging settings->Startup. This will cause modules and
symbols to be automatically resolved on connection.
Installing the Extension
To install the extension, download it from the most recent uefi_debug_tools release and add it to the extension path for the debugger. This can be done using the PowerShell commands below. Note that the architecture is the architecture of the host machine running Windbg, not the device being debugged.
Installing for X64 Host
Invoke-WebRequest -Uri "https://github.com/microsoft/uefi_debug_tools/releases/latest/download/uefiext_x64.zip" -OutFile "$env:TEMP\uefiext.zip"; Expand-Archive "$env:TEMP\uefiext.zip" -DestinationPath "$env:TEMP\uefiext" -Force; Copy-Item "$env:TEMP\uefiext\*" -Destination "C:\Users\$Env:UserName\AppData\Local\DBG\EngineExtensions\"
Installing for AArch64 Host
Invoke-WebRequest -Uri "https://github.com/microsoft/uefi_debug_tools/releases/latest/download/uefiext_arm64.zip" -OutFile "$env:TEMP\uefiext.zip"; Expand-Archive "$env:TEMP\uefiext.zip" -DestinationPath "$env:TEMP\uefiext" -Force; Copy-Item "$env:TEMP\uefiext\*" -Destination "C:\Users\$Env:UserName\AppData\Local\DBG\EngineExtensions\"
Symbols
Once running !uefiext.init, symbols will often resolve automatically, but there
can be several reasons why this doesn't happen. Symbol resolution can take two
paths: local symbol resolution or system server resolution.
Local Symbols
Symbols can automatically resolve because the PE header of the image contains the
path to the associated PDB file. This will be something like
E:\patina-dxe-core-qemu\target\x86_64-unknown-uefi\debug\deps\qemu_q35_dxe_core-251d7f9a6476b1c5.pdb
Windbg will then try to load this file to match the current image in memory.
A few reasons why this may not match are:
- The device running the debugger is not the same as the device that built the binary.
- The binary has been rebuilt, so the PDB no longer matches.
- The binary does not have the fully qualified path, e.g.
qemu_q35_dxe_core-251d7f9a6476b1c5.pdb
If you can locate the symbol files, inform Windbg of their location by adding their
directory to the symbol path. This can be done by running .sympath+ <path to sym dir>.
To see the full symbol path, run .sympath.
If issues persist, !sym noisy will enable noisy logging for symbol discovery to
better understand why it is unable to find the correct symbols.
Symbol Server
Setting up a symbol server might be the correct choice for official build systems, however, this is not detailed here. For more information, see the Symbol Server and Symbol Stores learn page.
Windbg Command Cheatsheet
For more details, see the Local Help in Windbg, but the following are some commonly used commands.
| Command | Description |
|---|---|
k | Display stack backtrace |
g | Resume execution |
p | Single step |
t | Step in |
gu | Step out |
dv | Display local variables |
dx | Display object, used for globals |
d[b/d/q] | Display bytes/dword/qword at provided address |
e[b/d/q] | Edit bytes/dword/qword at provided address |
r | Display registers. Can also edit registers. |
bp | Set a breakpoint at a provided address or symbol |
bl | List current breakpoints |
ba | Set an access breakpoint |
lm | List loaded modules |
x <module>!* | Display symbols for the provided module |
.sympath | Show symbol path. .sympath+ to add to symbol path |